Quantcast
Channel: R-bloggers
Viewing all 2417 articles
Browse latest View live

Open data sets you can use with R

$
0
0

(This article was first published on Revolutions, and kindly contributed to R-bloggers)

R is an environment for programming with data, so unless you're doing a simulation study you'll need some data to work with. If you don't have data of your own, we've made a list of open data sets you can use with R to accompany the latest release of Revolution R Open.

At the Data Sources on the Web page on MRAN, you can find links to dozens of open data sources both large and more. You'll find some classics of data science and machine learning, like the Enron emails data set, and the famous Airlines data. You can find official statistics on economics and government from countries around the world, including links to every country's official data repositories at UNdata. There are links to scientific data, including several sources from the social sciences. And of course you'll find links to various financial data sources (but not all of these are 100% free to use).

Many of the data sets are indicated as ready-to-use in R format; for the others, you can use R's various data import tools to access the data (for which there is a great guide at ComputerWorld).

Got other suggestions for great open data sources? Let us know in the comments below, or send an email to mran@revolutionanalytics.com.

MRAN: Data Sources on the Web

To leave a comment for the author, please follow the link and comment on his blog: Revolutions.

R-bloggers.com offers daily e-mail updates about R news and tutorials on topics such as: visualization (ggplot2, Boxplots, maps, animation), programming (RStudio, Sweave, LaTeX, SQL, Eclipse, git, hadoop, Web Scraping) statistics (regression, PCA, time series, trading) and more...

Granger Causality Test

$
0
0

(This article was first published on Yet Another Blog in Statistical Computing » S+/R, and kindly contributed to R-bloggers)
# READ QUARTERLY DATA FROM CSV
library(zoo)
ts1 <- read.zoo('Documents/data/macros.csv', header = T, sep = ",", FUN = as.yearqtr)

# CONVERT THE DATA TO STATIONARY TIME SERIES
ts1$hpi_rate <- log(ts1$hpi / lag(ts1$hpi))
ts1$unemp_rate <- log(ts1$unemp / lag(ts1$unemp))
ts2 <- ts1[1:nrow(ts1) - 1, c(3, 4)]

# METHOD 1: LMTEST PACKAGE
library(lmtest)
grangertest(unemp_rate ~ hpi_rate, order = 1, data = ts2)
# Granger causality test
#
# Model 1: unemp_rate ~ Lags(unemp_rate, 1:1) + Lags(hpi_rate, 1:1)
# Model 2: unemp_rate ~ Lags(unemp_rate, 1:1)
#   Res.Df Df      F  Pr(>F)
# 1     55
# 2     56 -1 4.5419 0.03756 *
# ---
# Signif. codes:  0 ‘***’ 0.001 ‘**’ 0.01 ‘*’ 0.05 ‘.’ 0.1 ‘ ’ 1

# METHOD 2: VARS PACKAGE
library(vars)
var <- VAR(ts2, p = 1, type = "const")
causality(var, cause = "hpi_rate")$Granger
#         Granger causality H0: hpi_rate do not Granger-cause unemp_rate
#
# data:  VAR object var
# F-Test = 4.5419, df1 = 1, df2 = 110, p-value = 0.0353

# AUTOMATICALLY SEARCH FOR THE MOST SIGNIFICANT RESULT
for (i in 1:4)
  {
  cat("LAG =", i)
  print(causality(VAR(ts2, p = i, type = "const"), cause = "hpi_rate")$Granger)
  }


To leave a comment for the author, please follow the link and comment on his blog: Yet Another Blog in Statistical Computing » S+/R.

R-bloggers.com offers daily e-mail updates about R news and tutorials on topics such as: visualization (ggplot2, Boxplots, maps, animation), programming (RStudio, Sweave, LaTeX, SQL, Eclipse, git, hadoop, Web Scraping) statistics (regression, PCA, time series, trading) and more...

R and Data Mining workshop at Deakin University

$
0
0

(This article was first published on blog.RDataMining.com, and kindly contributed to R-bloggers)

I will run a workshop on R and Data Mining for students in the Master of Business Analytics course at Deakin University in Melbourne on Thursday 28 May.

The workshop will cover:
– Introduction to Data Mining with R and Data Import/Export in R
– Data Exploration and Visualization with R
– Regression and Classification with R
– Data Clustering with R
– Association Rule Mining with R
– Text Mining with R — Twitter Data Analysis (updated for tm v0.6)

Workshop slides can be downloaded at
http://www.rdatamining.com/training


To leave a comment for the author, please follow the link and comment on his blog: blog.RDataMining.com.

R-bloggers.com offers daily e-mail updates about R news and tutorials on topics such as: visualization (ggplot2, Boxplots, maps, animation), programming (RStudio, Sweave, LaTeX, SQL, Eclipse, git, hadoop, Web Scraping) statistics (regression, PCA, time series, trading) and more...

Searching for the Steamer retroelement in the ocean metagenome

$
0
0

(This article was first published on What You're Doing Is Rather Desperate » R, and kindly contributed to R-bloggers)

Location of BLAST (tblastn) hits Mya arenaria GagPol (AIE48224.1) vs GOS contigs

Location of BLAST (tblastn) hits Mya arenaria GagPol (AIE48224.1) vs GOS contigs

Last week, I was listening to episode 337 of the podcast This Week in Virology. It concerned a retrovirus-like sequence element named Steamer, which is associated with a transmissible leukaemia in soft shell clams.

At one point the host and guests discussed the idea of searching for Steamer-like sequences in the data from ocean metagenomics projects, such as the Global Ocean Sampling expedition. Sounds like fun. So I made an initial attempt, using R/ggplot2 to visualise the results.

To make a long story short: the initial BLAST results are not super-convincing, the visualisation could use some work (click image, right, for larger version) and the code/data are all public at Github, summarised in this report. It made for a fun, relatively-quick side project.


Filed under: bioinformatics, R, statistics Tagged: cancer, clam, GOS, metagenomics, ocean, retroelement, steamer, twiv, virus

To leave a comment for the author, please follow the link and comment on his blog: What You're Doing Is Rather Desperate » R.

R-bloggers.com offers daily e-mail updates about R news and tutorials on topics such as: visualization (ggplot2, Boxplots, maps, animation), programming (RStudio, Sweave, LaTeX, SQL, Eclipse, git, hadoop, Web Scraping) statistics (regression, PCA, time series, trading) and more...

Communicating Risk at the Bay Area R User Group

$
0
0

(This article was first published on mages' blog, and kindly contributed to R-bloggers)
I will be speaking at the Bay Area User Group meeting tonight about Communicating Risk. Anthony Goldbloom from Kaggle and Karim Chine from ElasticR will be there as well. The meeting will be at Microsoft in Mountain View.

Later this week I will give a similar presentation at the R in Finance conference in Chicago. Please get in touch if you are around and would like to share a coffee with me.

To leave a comment for the author, please follow the link and comment on his blog: mages' blog.

R-bloggers.com offers daily e-mail updates about R news and tutorials on topics such as: visualization (ggplot2, Boxplots, maps, animation), programming (RStudio, Sweave, LaTeX, SQL, Eclipse, git, hadoop, Web Scraping) statistics (regression, PCA, time series, trading) and more...

New Version of RStudio (v0.99) Available Now

$
0
0

(This article was first published on RStudio Blog, and kindly contributed to R-bloggers)

We’re pleased to announce that the final version of RStudio v0.99 is available for download now. Highlights of the release include:

  • A new data viewer with support for large datasets, filtering, searching, and sorting.
  • Complete overhaul of R code completion with many new features and capabilities.
  • The source editor now provides code diagnostics (errors, warnings, etc.) as you work.
  • User customizable code snippets for automating common editing tasks.
  • Tools for Rcpp: completion, diagnostics, code navigation, find usages, and automatic indentation.
  • Many additional source editor improvements including multiple cursors, tab re-ordering, and several new themes.
  • An enhanced Vim mode with visual block selection, macros, marks, and subset of : commands.

There are also lots of smaller improvements and bug fixes across the product. Check out the v0.99 release notes for details on all of the changes.

Data Viewer

We’ve completely overhauled the data viewer with many new capabilities including live update, sorting and filtering, full text searching, and no row limit on viewed datasets.

data-viewer

See the data viewer documentation for more details.

Code Completion

Previously RStudio only completed variables that already existed in the global environment. Now completion is done based on source code analysis so is provided even for objects that haven’t been fully evaluated:

completion-scopes

Completions are also provided for a wide variety of specialized contexts including dimension names in [ and [[:

completion-bracket

Code Diagnostics

We’ve added a new inline code diagnostics feature that highlights various issues in your R code as you edit.

For example, here we’re getting a diagnostic that notes that there is an extra parentheses:

Screen Shot 2015-04-08 at 12.04.14 PM

Here the diagnostic indicates that we’ve forgotten a comma within a shiny UI definition:

diagnostics-comma

A wide variety of diagnostics are supported, including optional diagnostics for code style issues (e.g. the inclusion of unnecessary whitespace). Diagnostics are also available for several other languages including C/C++, JavaScript, HTML, and CSS. See the code diagnostics documentation for additional details.

Code Snippets

Code snippets are text macros that are used for quickly inserting common snippets of code. For example, the fun snippet inserts an R function definition:

Insert Snippet

If you select the snippet from the completion list it will be inserted along with several text placeholders which you can fill in by typing and then pressing Tab to advance to the next placeholder:

Screen Shot 2015-04-07 at 10.44.39 AM

Other useful snippets include:

  • lib, req, and source for the library, require, and source functions
  • df and mat for defining data frames and matrices
  • if, el, and ei for conditional expressions
  • apply, lapply, sapply, etc. for the apply family of functions
  • sc, sm, and sg for defining S4 classes/methods.

See the code snippets documentation for additional details.

Try it Out

RStudio v0.99 is available for download now. We hope you enjoy the new release and as always please let us know how it’s working and what else we can do to make the product better.


To leave a comment for the author, please follow the link and comment on his blog: RStudio Blog.

R-bloggers.com offers daily e-mail updates about R news and tutorials on topics such as: visualization (ggplot2, Boxplots, maps, animation), programming (RStudio, Sweave, LaTeX, SQL, Eclipse, git, hadoop, Web Scraping) statistics (regression, PCA, time series, trading) and more...

Situational Baseball: Analyzing Runs Potential Statistics

$
0
0

(This article was first published on Revolutions, and kindly contributed to R-bloggers)

By Mark Malter

A few weeks ago, I wrote about my Baseball Stats R shiny application, where I demonstrated how to calculate runs expectancies based on the 24 possible bases/outs states for any plate appearance.  In this article, I’ll explain how I expanded on that to calculate the probability of winning the game, based on the current score/inning/bases/outs state.  While this is done on other websites, I have added some unique play attempt features -- steal attempt, sacrifice bunt attempt, and tag from third attempt -- to show the probability of winning with and without the attempt, as well as the expected win probability given a user determined success rate for the play.  That way, a manager can not only know the expected runs based on a particular decision, but the actual probability of winning the game if the play is attempted.

After the user enters the score, inning, bases state, and outs, the code runs through a large number of simulated games using the expected runs to be scored over the remainder of the current half inning, as well as each succeeding half inning for the remainder of the game.

When there are runners on base and the user clicks on any of the ‘play attempt’ tabs, a new table is generated showing the new probabilities.  I allow for sacrifice bunts with less than two outs and a runner on first, second, or first and second.  The stolen base tab can be used with any number of outs and the possibility of stealing second, third, or both.  The tag from third tab will work as long as there is a runner on third and less than two outs prior to the catch.

I first got this idea after watching game seven of the 2014 World Series. Trailing 3-2 with two outs and nobody on base, Alex Gordon singled to center off of Madison Bumgarner and made it all the way to third base after a two base error.  As Gordon was approaching third base, the coach gave him the stop sign, as shortstop Brandon Crawford was taking the relay throw in short left field.  Had Gordon attempted to score on the play, he probably would have been out at the plate- game and series over.  However, by holding up at third base, the Royals are also still ‘probably’ going to lose since runners only score from third base with two outs about 26% of the time.

The calculator shows that the probability of winning a game down by one run with a runner on third and two outs in the bottom of the ninth (or an extra inning) is roughly 17%.  If we click on the ‘Tag from Third Attempt’ tab (Gordon attempting to score would have been equivalent to tagging from third after a catch for the second out), and play with the ‘Base running success rate’ slider, we see that the break even success rate is roughly 0.3.  I don’t know the probability of Gordon beating the throw home, but if it was greater than 0.3 then making the attempt would have improved the Royals chances of winning the World Series. In fact, if the true success rate was as much as 0.5 then the Royals win probability would have jumped by 11% to 28%.  

Here is the UI code.  Here is the server code. And here is the Shiny App.

>

To leave a comment for the author, please follow the link and comment on his blog: Revolutions.

R-bloggers.com offers daily e-mail updates about R news and tutorials on topics such as: visualization (ggplot2, Boxplots, maps, animation), programming (RStudio, Sweave, LaTeX, SQL, Eclipse, git, hadoop, Web Scraping) statistics (regression, PCA, time series, trading) and more...

New package on CRAN: lamW

$
0
0

(This article was first published on Strange Attractors » R, and kindly contributed to R-bloggers)

Recently, in various research projects, the Lambert-W function arose a number of times. Somewhat frustratingly, there is no built-in function in R to calculate it. The only options were those in the gsl and LambertW packages, the latter merely importing the former. Importing the entire GNU Scientific Library (GSL) can be a bit of a hassle, especially for those of us restricted to a Windows environment.

Therefore, I spent a little time and built a package for R whose sole purpose is to calculate the real-valued versions of the Lambert W function without the need for importing the GSL: the lamW package. It does depends on Rcpp, though. It could have been written in pure R, but as there are a number of loops involved which cannot be vectorized, and as Rcpp is fast becoming almost a base package, I figured that the speed and convenience was worth it.

A welcome outcome of this was that I think I finally wrapped my head around basic Padé approximation, which I use when calculating some parts of the primary branch of the Lambert-W. Eventually, I’d like to write a longer post about Padé approximation; when that will happen, who knows 8-).

To leave a comment for the author, please follow the link and comment on his blog: Strange Attractors » R.

R-bloggers.com offers daily e-mail updates about R news and tutorials on topics such as: visualization (ggplot2, Boxplots, maps, animation), programming (RStudio, Sweave, LaTeX, SQL, Eclipse, git, hadoop, Web Scraping) statistics (regression, PCA, time series, trading) and more...

A quick, incomplete comparison of ggplot2 & rbokeh plotting idioms

$
0
0

(This article was first published on rud.is » R, and kindly contributed to R-bloggers)

I set aside a small bit of time to give rbokeh a try and figured I’d share a small bit of code that shows how to make the “same” chart in both ggplot2 and rbokeh.

What is Bokeh/rbokeh?

rbokeh is an htmlwidget wrapper for the Bokeh visualization library that has become quite popular in Python circles. Bokeh makes creating interactive charts pretty simple and rbokeh lets you do it all with R syntax.

Comparing ggplot & rbokeh

This is not a comprehensive introduction into rbokeh. You can get that here (officially). I merely wanted to show how a ggplot idiom would map to an rbokeh one for those that may be looking to try out the rbokeh library and are familiar with ggplot. They share a very common “grammar of graphics” base where you have a plot structure and add layers and aesthetics. They each do this a tad bit differently, though, as you’ll see.

First, let’s plot a line graph with some markers in ggplot. The data I’m using is a small time series that we’ll use to plot a cumulative sum of via a line graph. It’s small enough to fit inline:

library(ggplot2)
library(rbokeh)
library(htmlwidgets)
 
structure(list(wk = structure(c(16069, 16237, 16244, 16251, 16279,
16286, 16300, 16307, 16314, 16321, 16328, 16335, 16342, 16349,
16356, 16363, 16377, 16384, 16391, 16398, 16412, 16419, 16426,
16440, 16447, 16454, 16468, 16475, 16496, 16503, 16510, 16517,
16524, 16538, 16552, 16559, 16566, 16573), class = "Date"), n = c(1L,
1L, 1L, 1L, 3L, 1L, 3L, 2L, 4L, 2L, 3L, 2L, 5L, 5L, 1L, 1L, 3L,
3L, 3L, 2L, 1L, 1L, 1L, 2L, 1L, 2L, 7L, 1L, 2L, 6L, 7L, 1L, 1L,
1L, 2L, 2L, 7L, 1L)), .Names = c("wk", "n"), class = c("tbl_df",
"tbl", "data.frame"), row.names = c(NA, -38L)) -> by_week
 
events <- data.frame(when=as.Date(c("2014-10-09", "2015-03-20", "2015-05-15")),
                     what=c("Thing1", "Thing2", "Thing2"))

The ggplot version is pretty straightforward:

gg <- ggplot()
gg <- gg + geom_vline(data=events,
                      aes(xintercept=as.numeric(when), color=what),
                      linetype="dashed", alpha=1/2)
gg <- gg + geom_text(data=events,
                     aes(x=when, y=1, label=what, color=what),
                     hjust=1.1, size=3)
gg <- gg + geom_line(data=by_week, aes(x=wk, y=cumsum(n)))
gg <- gg + scale_x_date(expand=c(0, 0))
gg <- gg + scale_y_continuous(limits=c(0, 100))
gg <- gg + labs(x=NULL, y="Cumulative Stuff")
gg <- gg + theme_bw()
gg <- gg + theme(panel.grid=element_blank())
gg <- gg + theme(panel.border=element_blank())
gg <- gg + theme(legend.position="none")
gg

We:

  • setup a base ggplot object
  • add a layer of marker lines (which are the 3 events dates)
  • add a layer of text for the marker lines
  • add a layer of the actual line – note that we can use cumsum(n) vs pre-compute it
  • setup scale and other aesthetic properties

That gives us this:

gg

Here’s a similar structure in rbokeh:

figure(width=550, height=375,
       logo="grey", outline_line_alpha=0) %>%
  ly_abline(v=events$when, color=c("red", "blue", "blue"), type=2, alpha=1/4) %>%
  ly_text(x=events$when, y=5, color=c("red", "blue", "blue"),
          text=events$what, align="right", font_size="7pt") %>%
  ly_lines(x=wk, y=cumsum(n), data=by_week) %>%
  y_range(c(0, 100)) %>%
  x_axis(grid=FALSE, label=NULL,
         major_label_text_font_size="8pt",
         axis_line_alpha=0) %>%
  y_axis(grid=FALSE,
         label="Cumulative Stuff",
         minor_tick_line_alpha=0,
         axis_label_text_font_size="10pt",
         axis_line_alpha=0) -> rb
rb

Here, we set the width and height and configure some of the initial aesthetic options. Note that outline_line_alpha=0 is the equivalent of theme(panel.border=element_blank()).

The markers and text do not work exactly as one might expect since there’s no way to specify a data parameter, so we have to set the colors manually. Also, since the target is a browser, points are specified in the same way you would with CSS. However, it’s a pretty easy translation from geom_[hv]line to ly_abline and geom_text to ly_text.

The ly_lines works pretty much like geom_line.

Notice that both ggplot and rbokeh can grok dates for plotting (though we do not need the as.numeric hack for rbokeh).

rbokeh will auto-compute bounds like ggplot would but I wanted the scale to go from 0 to 100 in each plot. You can think of y_range as ylim in ggplot.

To configure the axes, you work directly with x_axis and y_axis parameters vs theme elements in ggplot. To turn off only lines, I set the alpha to 0 in each and did the same with the y axis minor tick marks.

Here’s the rbokeh result:

NOTE: you can save out the widget with:

saveWidget(rb, file="rbokeh001.html")

and I like to use the following iframe settings to include the widgets:

<iframe style="max-width=100%" 
        src="rbokeh001.html" 
        sandbox="allow-same-origin allow-scripts" 
        width="100%" 
        height="400" 
        scrolling="no" 
        seamless="seamless" 
        frameBorder="0"></iframe>

Wrapping up

Hopefully this helped a bit with translating some ggplot idioms over to rbokeh and developing a working mental model of rbokeh plots. As I play with it a bit more I’ll add some more examples here in the event there are “tricks” that need to be exposed. You can find the code up on github and please feel free to drop a note in the comments if there are better ways of doing what I did or if you have other hints for folks.

To leave a comment for the author, please follow the link and comment on his blog: rud.is » R.

R-bloggers.com offers daily e-mail updates about R news and tutorials on topics such as: visualization (ggplot2, Boxplots, maps, animation), programming (RStudio, Sweave, LaTeX, SQL, Eclipse, git, hadoop, Web Scraping) statistics (regression, PCA, time series, trading) and more...

Respecting Real-World Decision Making and Rejecting Models That Do Not: No MaxDiff or Best-Worst Scaling

$
0
0

(This article was first published on Engaging Market Research, and kindly contributed to R-bloggers)


Utility has been reified, and we have committed the fallacy of misplaced concreteness.


As this link illustrates, Sawtooth's MaxDiff provides an instructive example of reification in marketing research. What is the contribution of "clean bathrooms" when selecting a fast food restaurant? When using the drive-thru window, the cleanliness of the bathrooms is never considered, yet that is not how we answer that self-report question, either in a rating scale or a best-worst choice exercise. Actual usage never enters the equation. Instead, the wording of the question invites us to enter a Platonic world of ideals inhabited by abstract concepts of "clean bathrooms" and "reasonable prices" where everything can be aligned on a stable and context-free utility scale. We "trade-off" the semantic meanings of these terms with the format of the question shaping our response, such is the nature of self-reports (see especially the Self-Reports paper from 1999).

On the other hand, in the real world sometimes clean bathrooms don't matter (drive-thru) and sometimes they are the determining factor (stopping along the highway during a long drive). Of course, we are assuming that we all agree on what constitutes a clean bathroom and that the perception of cleanliness does not depend on the comparison set (e.g., a public facility without running water). Similarly, "reasonable prices" has no clear referent with each respondent applying their own range each time they see the item in a different context.

It is just all so easy for a respondent to accept the rules of the game and play without much effort. The R package support.BWS (best-worst scaling) will generate the questionnaire with only a few lines of code. You can see two of the seven choice sets below. When the choice sets have been created using a balanced incomplete block design, a rank ordering of the seven fruits can be derived by subtracting the number of worst selections from the number of best picks. It is call "best-worst scaling" because you pick the best and worst from each set. Since the best-worst choice also identifies the pair that is most separated, some use the term MaxDiff rather than best-worst.

Q1
 Best Items  Worst
  [ ]  Apple    [ ]
  [ ]  Banana [ ]
  [ ]  Melon    [ ]
  [ ]  Pear      [ ]

Q2
 Best Items  Worst
  [ ]  Orange   [ ]
  [ ]  Grapes   [ ]
  [ ]  Banana   [ ]
  [ ]  Melon     [ ]

The terms of play require that we decontextualize in order to make a selection. Otherwise, we could not answer. I love apples, but not for breakfast, and they can be noisy and messy to eat in public. Grapes are good to share, and bananas are easy to take with you in a purse, a bag or a coat pocket. Now, if I am baking a pie or making a salad, it is an entirely different story. Importantly, this is where we find utility, not in the object itself, but in its usage. It is why we buy, and therefore, usage should be marketing's focus.

"Hiring Milkshakes"

Why would 40% of the milkshakes be sold in the early morning? The above link will explain the refreshment demands of the AM commute to work. It will also remind you of the wisdom from Theodore Levitt that one "hires" the quarter inch drill bit in order to produce the quarter inch hole. Utility resides not in the drill bit but in the value of what can be accomplished with the resulting hole. Of course, one buys the power tool in order to do much more than make holes, which brings us to the analysis of usage data.

In an earlier post on taking inventory, I outlined a approach for analyzing usage data when the most frequent response was no, never, none or not applicable. Inquiries about usage access episodic memory so the probes must be specific. Occasion needs to be mentioned for special purchases that would not be recalled without it. The result is high dimensional and sparse data matrices. Thus, while the produce market is filled with different varieties of fruit that can be purchased for various consumption occasions, the individual buyer samples only a small subset of this vast array. Fortunately, R provides a number of approaches, including the non-negative matrix factorization (NMF) outlined in my taking inventory post. We should be careful not to forget that context matters when modeling human judgment and choice.

Note: I believe that the R package support.BWS was added to the CRAN about the time that I posted "Why doesn't R have a MaxDiff package?". As its name implies, the package supports the design, administer and analysis of data using best-worst scaling. However, support.BWS does not attempt to replicate the hierarchical Bayes' estimation implemented in Sawtooth's MaxDiff, which was what was meant by R does not have a MaxDiff package.

To leave a comment for the author, please follow the link and comment on his blog: Engaging Market Research.

R-bloggers.com offers daily e-mail updates about R news and tutorials on topics such as: visualization (ggplot2, Boxplots, maps, animation), programming (RStudio, Sweave, LaTeX, SQL, Eclipse, git, hadoop, Web Scraping) statistics (regression, PCA, time series, trading) and more...

the Flatland paradox [#2]

$
0
0

(This article was first published on Xi'an's Og » R, and kindly contributed to R-bloggers)

flatlandAnother trip in the métro today (to work with Pierre Jacob and Lawrence Murray in a Paris Anticafé!, as the University was closed) led me to infer—warning!, this is not the exact distribution!—the distribution of x, namely

f(x|N) 
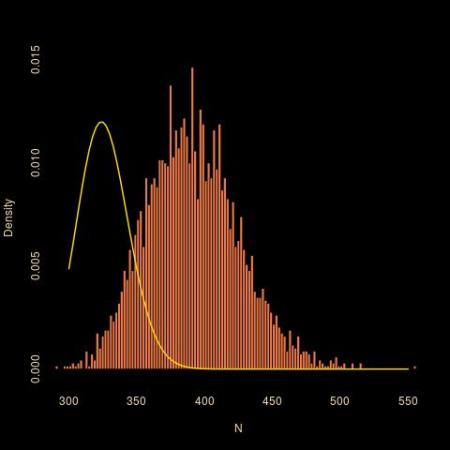
= \frac{4^p}{4^{\ell+2p}} {\ell+p \choose p}\,\mathbb{I}_{N=\ell+2p}

since a path x of length l(x) will corresponds to N draws if N-l(x) is an even integer 2p and p undistinguishable annihilations in 4 possible directions have to be distributed over l(x)+1 possible locations, with Feller’s number of distinguishable distributions as a result. With a prior π(N)=1/N on N, hence on p, the posterior on p is given by

\pi(p|x) \propto 4^{-p} {\ell+p \choose p} \frac{1}{\ell+2p}

Now, given N and  x, the probability of no annihilation on the last round is 1 when l(x)=N and in general

\frac{4^p}{4^{\ell+2p}}{\ell-1+p \choose p}\big/\frac{4^p}{4^{\ell+2p}}{\ell+p \choose p}=\frac{\ell}{\ell+p}=\frac{2\ell}{N+\ell}

which can be integrated against the posterior. The numerical expectation is represented for a range of values of l(x) in the above graph. Interestingly, the posterior probability is constant for l(x) large  and equal to 0.8125 under a flat prior over N.

flatelGetting back to Pierre Druilhet’s approach, he sets a flat prior on the length of the path θ and from there derives that the probability of annihilation is about 3/4. However, “the uniform prior on the paths of lengths lower or equal to M” used for this derivation which gives a probability of length l proportional to 3l is quite different from the distribution of l(θ) given a number of draws N. Which as shown above looks much more like a Binomial B(N,1/2).

flatpostHowever, being not quite certain about the reasoning involving Fieller’s trick, I ran an ABC experiment under a flat prior restricted to (l(x),4l(x)) and got the above, where the histogram is for a posterior sample associated with l(x)=195 and the gold curve is the potential posterior. Since ABC is exact in this case (i.e., I only picked N’s for which l(x)=195), ABC is not to blame for the discrepancy! Here is the R code that goes with the ABC implementation:

#observation:
elo=195
#ABC version
T=1e6
el=rep(NA,T)
N=sample(elo:(4*elo),T,rep=TRUE)
for (t in 1:T){
#generate a path
  paz=sample(c(-(1:2),1:2),N[t],rep=TRUE)
#eliminate U-turns
  uturn=paz[-N[t]]==-paz[-1]
  while (sum(uturn>0)){
    uturn[-1]=uturn[-1]*(1-
              uturn[-(length(paz)-1)])
    uturn=c((1:(length(paz)-1))[uturn==1],
            (2:length(paz))[uturn==1])
    paz=paz[-uturn]
    uturn=paz[-length(paz)]==-paz[-1]
    }
  el[t]=length(paz)}
#subsample to get exact posterior
poster=N[abs(el-elo)==0]

Filed under: Books, Kids, R, Statistics, University life Tagged: ABC, combinatorics, exact ABC, Flatland, improper priors, Larry Wasserman, marginalisation paradoxes, paradox, Pierre Druilhet, random walk, subjective versus objective Bayes, William Feller

To leave a comment for the author, please follow the link and comment on his blog: Xi'an's Og » R.

R-bloggers.com offers daily e-mail updates about R news and tutorials on topics such as: visualization (ggplot2, Boxplots, maps, animation), programming (RStudio, Sweave, LaTeX, SQL, Eclipse, git, hadoop, Web Scraping) statistics (regression, PCA, time series, trading) and more...

drat 0.0.4: Yet more features and documentation

$
0
0

(This article was first published on Thinking inside the box , and kindly contributed to R-bloggers)

A new version, now at 0.0.4, of the drat package arrived on CRAN yesterday. Its name stands for drat R Archive Template, and it helps with easy-to-create and easy-to-use repositories for R packages, and is finding increasing by other projects.

Version 0.0.4 brings both new code and more documentation:

  • support for binary repos on Windows and OS X thanks to Jan Schulz;
  • new (still raw) helper functions initRepo() to create a git-based repository, and pruneRepo() to remove older versions of packages;
  • the insertRepo() functions now uses tryCatch() around git commands (with thanks to Carl Boettiger);
  • when adding a file to a drat repo we ensure that the repo path does not contains spaces (with thank to Stefan Bache);
  • stress that file-based repos need a URL of the form file:/some/path with one colon but not two slashes (also thanks to Stefan Bache);
  • new Using Drat with Travis CI vignette thanks to Colin Gillespie;
  • new Drat FAQ vignette;
  • other fixes and extensions.

Courtesy of CRANberries, there is a comparison to the previous release. More detailed information is on the drat page.

This post by Dirk Eddelbuettel originated on his Thinking inside the box blog. Please report excessive re-aggregation in third-party for-profit settings.

To leave a comment for the author, please follow the link and comment on his blog: Thinking inside the box .

R-bloggers.com offers daily e-mail updates about R news and tutorials on topics such as: visualization (ggplot2, Boxplots, maps, animation), programming (RStudio, Sweave, LaTeX, SQL, Eclipse, git, hadoop, Web Scraping) statistics (regression, PCA, time series, trading) and more...

Is This How You Dplyr?

$
0
0

(This article was first published on Jeffrey Horner, and kindly contributed to R-bloggers)

Yesterday I ran into a fairly complex issue regarding dplyr mutation and I wanted to get your take on my solution.

I have two data frames with the same identifiers and two different date columns which I need to merge into one date column, with the value of the earlier of the two dates if both are present, or any valid date when one or the other is present, or just NA when no date is present (kinda sad when you can’t get a date :).

library(wakefield)
library(tidyr)
library(dplyr)

x <- r_data_frame(n=10,id,date_stamp(name='foo',random=TRUE))
y <- r_data_frame(n=10,id,date_stamp(name='bar',random=TRUE))

x$foo[base::sample(10,5)] <- NA
y$bar[base::sample(10,5)] <- NA

First Attempt: Just Use Min

full_join(x,y,by='ID') %>% mutate(start=min(foo,bar))
## Source: local data frame [10 x 4]
## 
##    ID        foo        bar start
## 1  01       <NA>       <NA>  <NA>
## 2  02 2014-08-27 2015-04-27  <NA>
## 3  03 2014-07-27       <NA>  <NA>
## 4  04       <NA> 2015-02-27  <NA>
## 5  05       <NA> 2015-02-27  <NA>
## 6  06 2014-09-27       <NA>  <NA>
## 7  07 2014-09-27 2014-09-27  <NA>
## 8  08       <NA> 2015-02-27  <NA>
## 9  09 2014-07-27       <NA>  <NA>
## 10 10       <NA>       <NA>  <NA>

Nope.

Second Attempt: Min With Rowwise

full_join(x,y,by='ID') %>% rowwise() %>% mutate(start=min(foo,bar))
## Source: local data frame [10 x 4]
## Groups: <by row>
## 
##    ID        foo        bar start
## 1  01       <NA>       <NA>    NA
## 2  02 2014-08-27 2015-04-27 16309
## 3  03 2014-07-27       <NA>    NA
## 4  04       <NA> 2015-02-27    NA
## 5  05       <NA> 2015-02-27    NA
## 6  06 2014-09-27       <NA>    NA
## 7  07 2014-09-27 2014-09-27 16340
## 8  08       <NA> 2015-02-27    NA
## 9  09 2014-07-27       <NA>    NA
## 10 10       <NA>       <NA>    NA

Umm. It looks like it works when both dates are present but not when one is NA.

Third Attempt: Min With na.rm=TRUE And Rowwise

full_join(x,y,by='ID') %>% rowwise() %>% mutate(start=min(foo,bar,na.rm=TRUE))
## Warning in min(NA_real_, NA_real_, na.rm = TRUE): no non-missing arguments
## to min; returning Inf
## Warning in min(NA_real_, NA_real_, na.rm = TRUE): no non-missing arguments
## to min; returning Inf
## Source: local data frame [10 x 4]
## Groups: <by row>
## 
##    ID        foo        bar start
## 1  01       <NA>       <NA>   Inf
## 2  02 2014-08-27 2015-04-27 16309
## 3  03 2014-07-27       <NA> 16278
## 4  04       <NA> 2015-02-27 16493
## 5  05       <NA> 2015-02-27 16493
## 6  06 2014-09-27       <NA> 16340
## 7  07 2014-09-27 2014-09-27 16340
## 8  08       <NA> 2015-02-27 16493
## 9  09 2014-07-27       <NA> 16278
## 10 10       <NA>       <NA>   Inf

Wow, this output reads: WARNING you are hurting dplyr’s head!

Final Solution: Custom Function With Class Fiddling

date_min <- function(x,y){
  if (!is.na(x)){
    if (!is.na(y)){
      return(min(x,y))
    } else {
      return(x)
    }
  } else if (!is.na(y)){
    return(y)
  }
  return(x)
}
z <- full_join(x,y,by='ID') %>% rowwise() %>% mutate(start=date_min(foo,bar))
class(z$start) <- 'Date'
z
## Source: local data frame [10 x 4]
## Groups: <by row>
## 
##    ID        foo        bar      start
## 1  01       <NA>       <NA>       <NA>
## 2  02 2014-08-27 2015-04-27 2014-08-27
## 3  03 2014-07-27       <NA> 2014-07-27
## 4  04       <NA> 2015-02-27 2015-02-27
## 5  05       <NA> 2015-02-27 2015-02-27
## 6  06 2014-09-27       <NA> 2014-09-27
## 7  07 2014-09-27 2014-09-27 2014-09-27
## 8  08       <NA> 2015-02-27 2015-02-27
## 9  09 2014-07-27       <NA> 2014-07-27
## 10 10       <NA>       <NA>       <NA>

So, is this the right way. How would you do it?

Also, what’s the data.table approach?

To leave a comment for the author, please follow the link and comment on his blog: Jeffrey Horner.

R-bloggers.com offers daily e-mail updates about R news and tutorials on topics such as: visualization (ggplot2, Boxplots, maps, animation), programming (RStudio, Sweave, LaTeX, SQL, Eclipse, git, hadoop, Web Scraping) statistics (regression, PCA, time series, trading) and more...

R #1 by Wide Margin in Latest KDnuggets Poll

$
0
0

(This article was first published on r4stats.com » R, and kindly contributed to R-bloggers)

The results of the latest KDnuggets Poll on software for Analytics, Big Data and Data Mining are out, and R has moved into the #1 position by a wide margin. I’ve updated the Surveys of Use section of The Popularity of Data Analysis Software to include a subset of those results, which I include here:

…The results of a similar poll done by the KDnuggets.com web site in May of 2015 are shown in Figure 6b. This one shows R in first place with 46.9% of users reporting having used it for a real project. RapidMiner, SQL, and Python follow quite a bit lower with around 30% of users. Then at around 20% are Excel, KNIME and HADOOP. It’s interesting to see what has happened to two very similar tools, RapidMiner and KNIME. Both used to be free and open source. RapidMiner then adopted a commercial model, with an older version still free. KNIME kept its desktop version free and, likely as a result, its use has more than tripled over the last three years. SAS Enterprise Miner uses a very similar workflow interface, and its reported use, while low, has almost doubled over the last three years. Figure 6b only shows those packages that have at least 5% market share. KDnuggets’ original graph and detailed analysis are here.

KDnuggests 2015

Figure 6b. Percent of respondents that used each software in KDnuggets’ 2015 poll. Only software with 5% market share are shown. The % alone is the percent of tool voters that used only that tool alone. For example, only 3.6% of R users have used only R, while 13.7% of RapidMiner users indicated they used that tool alone. Years are color coded, with 2015, 2014, 2013 from top to bottom.

I invite you to follow me here or at http://twitter.com/BobMuenchen. If you’re interested in learning R, DataCamp.com offers my 16-hour interactive workshop, R for SAS, SPSS and Stata Users for $25. That’s a monthly fee, but it definitely won’t take you a month to take it!  For students & academics, it’s $9. I also do R training on-site.


To leave a comment for the author, please follow the link and comment on his blog: r4stats.com » R.

R-bloggers.com offers daily e-mail updates about R news and tutorials on topics such as: visualization (ggplot2, Boxplots, maps, animation), programming (RStudio, Sweave, LaTeX, SQL, Eclipse, git, hadoop, Web Scraping) statistics (regression, PCA, time series, trading) and more...

R tops 2015 KDnuggets Software Poll

$
0
0

(This article was first published on Revolutions, and kindly contributed to R-bloggers)

R is the leading choice for Predictive Analytics / Data Mining / Data Science software according to the results of the 2015 KDnuggets Software Poll, now in its 16th year. Each of the 28,000 participants selected one or more tools they had used in the last year from a list of 93 options, and R was selected by 46.9% of participants (up from 38.5% in 2015). The top 10 most-selected tools are listed in the table below:

KDnuggets 2015

R reclaims its top ranking from Rapidminer, which placed second in this year's poll. (While many vendors and evangelists (yours truly included) encouraged  users to vote in the poll, pollster Gregory Piatetsky reports that he "not found any bot or illegal voting, and did not have to remove any votes".) A notable entrant to the top 10 this year is Spark, which is showing great traction for in-Hadoop analytics. The top 3 newcomers in the poll for 2015 were: the scikit-learn suite for Python; Azure ML and Power BI.

One other notable result from the poll is that 73% of respondents are using at least one open-source tool in their work, and 9% use solely open-source tools.

For the full results of the poll and sub-analyses of the different tool categories, follow the link below.

KDnuggets: 16th annual KDnuggets Software Poll

To leave a comment for the author, please follow the link and comment on his blog: Revolutions.

R-bloggers.com offers daily e-mail updates about R news and tutorials on topics such as: visualization (ggplot2, Boxplots, maps, animation), programming (RStudio, Sweave, LaTeX, SQL, Eclipse, git, hadoop, Web Scraping) statistics (regression, PCA, time series, trading) and more...

8 new R jobs (2015-05-27)

$
0
0

This is the bimonthly post (for 2015-05-27) for new R Jobs from R-users.com.

Employers: visit this link to post a new R job to the R community (it’s free and quick).

Job seekers: please follow the links below to learn more and apply for your job of interest (or visit previous R jobs posts).


  1. Full-Time
    BI Data Analyst Consultant (@Bristol)
    KETL Limited – Posted by Helen Woodcock
    BristolEngland, United Kingdom
    21 May2015
  2. Full-Time
    Data Scientist (@Chicago, over 100K/year)
    Argo International – Posted by Undercurrent
    ChicagoIllinois, United States
    20 May2015
  3. Internship
    Data Scientist Intern (Paid)
    Morning Consult – Posted by morningconsult
    WashingtonDistrict of Columbia, United States
    20 May2015
  4. Full-Time
    Data Scientist at The Weather Company
    The Weather Company – Posted by weather1
    New YorkNew York, United States
    18 May2015
  5. Full-Time
    Data Scientist (Tel Aviv)
    Nirit Privman/SOOMLA – Posted by Nirit Privman
    Tel Aviv-YafoTel Aviv District, Israel
    18 May2015
  6. Temporary
    R Developer (6 months + – £350 to £450 per day – Central London)
    Damia Group Ltd – Posted by nathandennis
    LondonEngland, United Kingdom
    18 May2015
  7. Full-Time
    Data scientist (in Tel-Aviv)
    BIT HR – Posted by BIT – HR
    Tel Aviv-YafoTel Aviv District, Israel
    16 May2015
  8. Temporary
    R developer for Business Development purposes
    A L Technologies Pvt Ltd – Posted by Jagadish Kumar
    NarasaraopetAndhra Pradesh, India
    13 May2015


r_jobs

Creating Styled Google Maps in ggmap

$
0
0

(This article was first published on Stats and things, and kindly contributed to R-bloggers)

In R, my go to package for creating maps is ggmap. Using this, one can create maps using a variety of services, including Google maps. I just recently discovered the ability to create a styled version of a Google map. Let's go through this process to create a black and white map of Chicago, with the parks shown in red.

First, go to the Styled Maps Wizard and type in “Chicago IL”.


You are shown the stock Google map of Chicago, with some sliders to change various attributes of the map.

Let's take the “saturation” slider down to -100 and bump up the “gamma” slider to .5.

Then, we can work on making the parks red. First, click the “Add” button on the right side.

Next, on the left side at the top, choose “Point of Interest”, then “Park”.

Then, click the “Color” box and type in “#ff0000” into the box to specify red for the parks You should see the parks highlighted in red now.

The last thing we need is to grab the JSON for these styles. On the right side, at the bottom of the “Map Style” box, click “Show JSON”.

With this JSON, we can create the map in ggmaps.
library("RJSONIO")
library("ggmap")
library("magrittr")
style <- '[
{
"stylers": [
{ "saturation": -100 },
{ "gamma": 0.5 }
]
},{
"featureType": "poi.park",
"stylers": [
{ "color": "#ff0000" }
]
}
]'
style_list <- fromJSON(style, asText=TRUE)

create_style_string<- function(style_list){
style_string <- ""
for(i in 1:length(style_list)){
if("featureType" %in% names(style_list[[i]])){
style_string <- paste0(style_string, "feature:",
style_list[[i]]$featureType, "|")
}
elements <- style_list[[i]]$stylers
a <- lapply(elements, function(x)paste0(names(x), ":", x)) %>%
unlist() %>%
paste0(collapse="|")
style_string <- paste0(style_string, a)
if(i < length(style_list)){
style_string <- paste0(style_string, "&style=")
}
}
# google wants 0xff0000 not #ff0000
style_string <- gsub("#", "0x", style_string)
return(style_string)
}

style_string <- create_style_string(style_list)
mymap <- ggmap(get_googlemap("chicago", size=c(800,800), style=style_string), extent="device")
ggsave(filename="pics/mymap.png", width=8, height=8)

I wrote the helper function “create_style_string” to take the style parameters given from Google as JSON, and create a string to use in the API request. Put that style_string in the “style” parameter in get_googlemap() and you get your map back.

The possibilities are endless to create maps with colored placenames, water, places of interest, etc. Very cool stuff.

To leave a comment for the author, please follow the link and comment on his blog: Stats and things.

R-bloggers.com offers daily e-mail updates about R news and tutorials on topics such as: visualization (ggplot2, Boxplots, maps, animation), programming (RStudio, Sweave, LaTeX, SQL, Eclipse, git, hadoop, Web Scraping) statistics (regression, PCA, time series, trading) and more...

Beta unblockers

$
0
0

A couple of weeks ago, we’ve uploaded the new version of BCEA on CRAN, to include the function implementing our method for the computation of the EVPPI based on INLA-SPDE $-$ I’ve also already mentioned this here.

While this is a stable version, we are still continuously testing many of the functions and so I thought I’d keep a beta version on the BCEA website (I’ve uploaded both a .tar.gz and a .zip file). I will continue to modify this beta version in the next few months, including minor changes/improvements $-$ I don’t think these will really affect the basic use of BCEA, but may be relevant in terms of advanced users, for example for customisation of the graphs.

So, BCEA users out there: do tell us what you really, really want $-$ we may even try and implement it for you…

2015 Fantasy Football Projections using OpenCPU

$
0
0

(This article was first published on Fantasy Football Analytics » R | Fantasy Football Analytics, and kindly contributed to R-bloggers)

We are releasing our 2015 fantasy football projections in an OpenCPU app.  The app allows you to calculate custom rankings/projections for your league based on your league settings.  The projections incorporate more sources of projections than any other site, and have been the most accurate projections over the last 3 years.  You can access the Projections app here:

http://apps.fantasyfootballanalytics.net/projections

For instructions how to use the app, see here.  We will be updating the projections as the season approaches with more sources of projections.  Feel free to add suggestions in the comments!

Projections

The post 2015 Fantasy Football Projections using OpenCPU appeared first on Fantasy Football Analytics.

To leave a comment for the author, please follow the link and comment on his blog: Fantasy Football Analytics » R | Fantasy Football Analytics.

R-bloggers.com offers daily e-mail updates about R news and tutorials on topics such as: visualization (ggplot2, Boxplots, maps, animation), programming (RStudio, Sweave, LaTeX, SQL, Eclipse, git, hadoop, Web Scraping) statistics (regression, PCA, time series, trading) and more...

No THIS Is How You Dplyr and Data.Table!

$
0
0

(This article was first published on Jeffrey Horner, and kindly contributed to R-bloggers)

So, I got some great solutions to my dplyr mutation problem to share. Just wait until you see these things!

Remember, I was having trouble reconciling two date columns into a minimum value in the presence of NA values.

Here’s the fake data again:

library(wakefield)
library(tidyr)
library(dplyr)
library(data.table)

x <- r_data_frame(n=10,id,date_stamp(name='foo',random=TRUE))
y <- r_data_frame(n=10,id,date_stamp(name='bar',random=TRUE))

x$foo[base::sample(10,5)] <- NA
y$bar[base::sample(10,5)] <- NA

Eddie Niedermeyer Solves It Perfectly with pmin

And a shout out to Mark as well for suggesting pmin and his partial solution with data.table.

full_join(x,y,by='ID') %>% mutate(start = pmin(foo, bar, na.rm = TRUE))
## Source: local data frame [10 x 4]
## 
##    ID        foo        bar      start
## 1  01       <NA>       <NA>       <NA>
## 2  02 2015-01-28 2015-02-28 2015-01-28
## 3  03       <NA> 2015-03-28 2015-03-28
## 4  04 2014-10-28 2014-10-28 2014-10-28
## 5  05       <NA> 2014-08-28 2014-08-28
## 6  06 2015-05-28 2014-10-28 2014-10-28
## 7  07       <NA>       <NA>       <NA>
## 8  08 2014-07-28       <NA> 2014-07-28
## 9  09       <NA>       <NA>       <NA>
## 10 10 2014-09-28       <NA> 2014-09-28

But Kirill Kills It With dplyr AND data.table

Now this is a thing of beauty! A dplyr join, magrittr pipe action, and what do we see??!? data.table syntax with old school boolean T value?

Oh man, I’m lovin’ it!

Nice one, Kirill, nice one.

full_join(x,y,by='ID') %>% data.table %>% .[, start := pmin(foo, bar, na.rm = T)] %>% print
##     ID        foo        bar      start
##  1: 01       <NA>       <NA>       <NA>
##  2: 02 2015-01-28 2015-02-28 2015-01-28
##  3: 03       <NA> 2015-03-28 2015-03-28
##  4: 04 2014-10-28 2014-10-28 2014-10-28
##  5: 05       <NA> 2014-08-28 2014-08-28
##  6: 06 2015-05-28 2014-10-28 2014-10-28
##  7: 07       <NA>       <NA>       <NA>
##  8: 08 2014-07-28       <NA> 2014-07-28
##  9: 09       <NA>       <NA>       <NA>
## 10: 10 2014-09-28       <NA> 2014-09-28

To leave a comment for the author, please follow the link and comment on his blog: Jeffrey Horner.

R-bloggers.com offers daily e-mail updates about R news and tutorials on topics such as: visualization (ggplot2, Boxplots, maps, animation), programming (RStudio, Sweave, LaTeX, SQL, Eclipse, git, hadoop, Web Scraping) statistics (regression, PCA, time series, trading) and more...
Viewing all 2417 articles
Browse latest View live